

In the ever-evolving digital landscape, eCommerce Sales has become not just a convenience but a necessity. Whether you’re an entrepreneur, a marketer, or an investor, understanding the intricacies of digital product sales is no longer optional—it’s essential.
This guide aims to be your one-stop resource for digital product and e-commerce statistics, offering crucial insights to help you make informed decisions. From revenue stats to market projections and case studies, this guide has it all.
Summary of Statistics
Our dataset categorizes statistics into three primary types:
- Sales Revenue: Statistics offering insights into online sales revenue.
- Market Projection: Forecasts and future trends in digital sales.
- Market Share: Information about the market share of different e-commerce platforms.
Table of Contents
Detailed Statistics and Insights for eCommerce Sales
Here are the statistics from the dataset, sorted by type and presented in bullet-point format:
Sales Revenue
Stat: Online retail ecommerce sales amounted to $4.9 trillion globally in 2021.
- Insight: The market size is colossal, offering ample opportunities for new and existing players.
- Source: Ecommerce Platforms
Stat: E-commerce sales were $870 billion in the US in 2021.
- Insight: The U.S. is a major contributor to global ecommerce sales, indicating a mature market.
- Source: Ecommerce Platforms
Stat: Consumers shelled out $9.12 billion in online purchases during Black Friday 2022.
Insight: The enormous spending on a single day highlights Black Friday’s enduring relevance in the ecommerce calendar. This suggests that businesses should prioritize Black Friday strategies to capitalize on consumer willingness to spend.
Source: Adobe News

Year-over-Year Growth: The bar chart shows consistent year-over-year growth in ecommerce retail sales worldwide, from $5.211 trillion in 2021 to a projected $8.148 trillion in 2026.
Breaking $6 Trillion: The year 2023 marks the first time ecommerce retail sales are projected to exceed $6 trillion, reaching $6.310 trillion.
Fastest Growth: The largest year-over-year growth is projected between 2025 and 2026, with an increase of $0.620 trillion.
Steady Climb: There is a steady climb in ecommerce sales each year, without any years showing a decline or plateau. This suggests a healthy and growing ecommerce market.
Nearing Double: By the end of the period in 2026, ecommerce retail sales are projected to be nearly double what they were in 2021.
Market Projection
- Stat: The global e-commerce market is expected to reach $6.5 trillion by 2023.
- Insight: The market is set to grow significantly, indicating a favorable environment for investment.
- Source: Forbes
Stat: By the end of 2025, worldwide online retail sales are expected to reach $10 trillion.
- Insight: Long-term projections for the e-commerce market are robust, suggesting sustained growth.
- Source: Yaguara
Stat: The experts predicted that the number of e-commerce users would reach 3.5 billion by 2023.
- Insight: The increasing user base signifies greater market penetration and opportunities for sales.
- Source: Ecommerce Platforms
Stat: The market for e-commerce fraud detection and prevention is projected to exceed $69 billion by 2025.
Insight: The significant growth in this market indicates the rising challenges and complexities associated with e-commerce fraud. It emphasizes the need for businesses to invest in sophisticated fraud prevention tools to protect both themselves and their customers.
Source: Statista
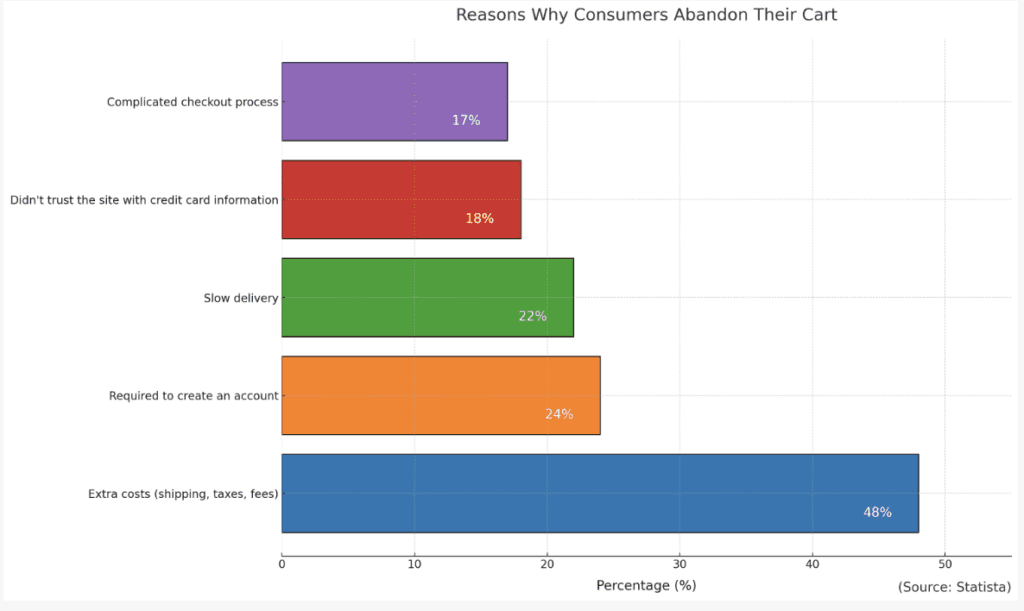
Extra costs (shipping, taxes, fees): Account for 48% of cart abandonments. This is the leading reason consumers decide not to complete their purchases.
Required to create an account: Causes 24% of consumers to abandon their carts. The requirement to create an account can be a significant barrier for some shoppers.
Slow delivery: Is a concern for 22% of consumers, leading them to abandon their carts. Delivery speed can be a critical factor in the decision-making process.
Didn’t trust the site with credit card information: This issue accounts for 18% of cart abandonments. Trust and security are fundamental concerns for online shoppers.
Complicated checkout process: Results in 17% of cart abandonments. A complex or confusing checkout process can deter consumers from finalizing their purchases.
Market Share
Stat: Alibaba has a 58% market share in Chinese e-commerce sales.
- Insight: Alibaba dominates the Chinese market, making it a crucial platform for businesses targeting China.
- Source: Shopify
Stat: Amazon’s e-commerce sales in the United States are expected to reach $367.19 billion in 2023.
- Insight: Amazon continues to dominate the U.S. market, making it a key platform for businesses and sellers.
- Source: Shopify
Stat: 45.6% of all e-commerce sales worldwide were made on mobile devices in 2021.
- Insight: Mobile commerce is a significant segment that businesses must pay attention to.
- Source: Shopify
Stat: The top three companies in e-commerce are Amazon, JD.com, and Alibaba.
- Insight: These companies are the leaders in the e-commerce space, and any strategic shifts by them can significantly impact the market.
- Source: Shopify
Stat: 96.9 million people in the United States shop on social media.
Insight: With nearly 100 million social media shoppers in the U.S. alone, social platforms are rapidly becoming a key shopping channel. This presents a compelling opportunity for businesses to diversify their ecommerce strategies and reach a highly engaged audience.
Source: Statista – Number of Social Media Shoppers in the United States
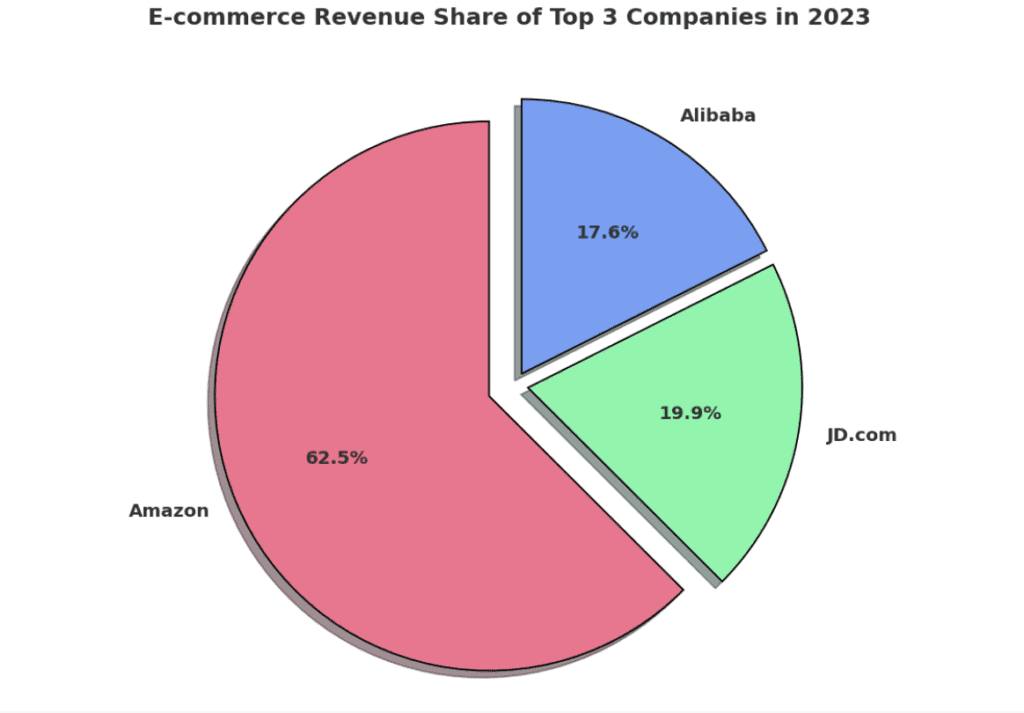
Overall Market Share: The pie chart represents the e-commerce revenue of the top three companies in the sector for the year 2023.
Amazon’s Dominance: Amazon is the market leader, accounting for approximately 65.7% of the combined revenue of these top three companies.
JD.com: JD.com has a substantial presence but is considerably smaller than Amazon, making up about 20.8% of the combined revenue.
Alibaba: Alibaba closely follows JD.com with a market share of around 18.5% of the total revenue generated by these three companies.
Revenue Figures:
- Amazon: $469 Billion
- JD.com: $149 Billion
- Alibaba: $132 Billion
Overall Insights
The eCommerce Sales statistics collectively suggest a thriving digital product sales ecosystem. Notably:
- Market Growth: The e-commerce market is not just large but also growing rapidly, with projections indicating a rise to $10 trillion by 2025 for ecommerce sales.
- Geographical Insights: While the U.S. remains a dominant player, China’s market, led by Alibaba, is also significant. This suggests that businesses need a global strategy.
- Mobile Importance: With nearly half of all ecommerce sales coming from mobile devices, a mobile-friendly approach is no longer optional but essential.
- Key Players: Amazon, JD.com, and Alibaba are the companies to watch. Their strategies and market performance can serve as indicators for market trends.
Love Statistics? Love No Code? Well you might want to read 21 Eye-Opening No Code Low Code Statistics You Can’t Ignore in 2023
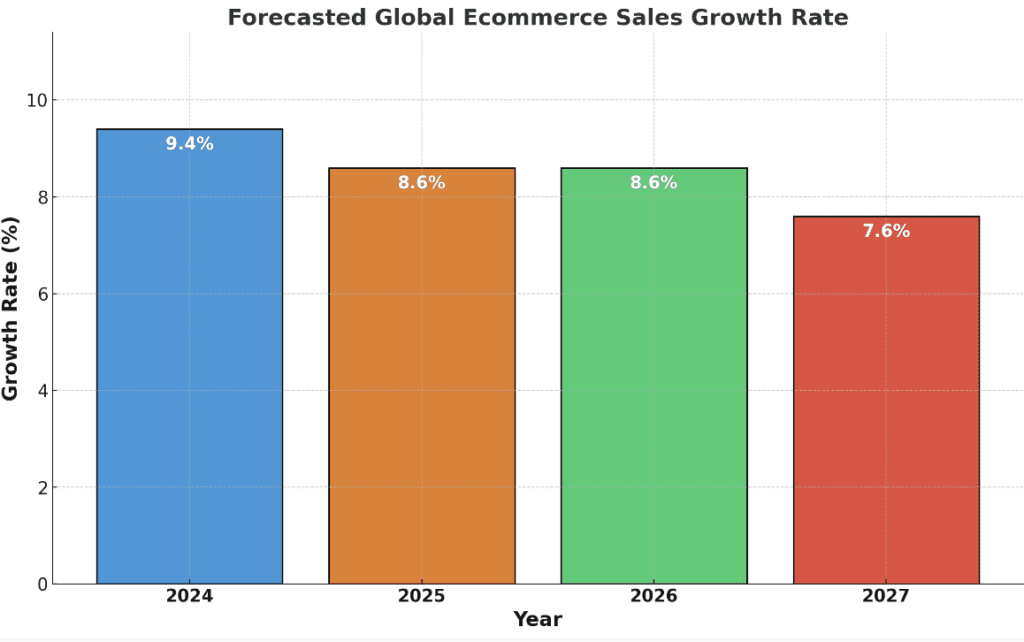
Forecast Period: The chart shows forecasts for global ecommerce sales growth rates for the years 2024 to 2027.
2024 Forecast: In 2024, the growth rate is expected to be 9.4%, which is the highest among the four years shown.
Steady Pace in 2025 and 2026: The growth rate is predicted to decelerate slightly to 8.6% in 2025 and hold steady at the same rate in 2026.
Decline in 2027: A further decline in the growth rate is anticipated in 2027, dropping to 7.6%.
Color Coding: Each year is represented by a distinct color—blue for 2024, orange for 2025, green for 2026, and red for 2027—for easy identification.
Overall Trend: The general trend indicates a gradual decrease in the growth rate of global ecommerce sales over the forecast period.
Case Studies
Envelopes.com
- Insight: Improved their conversion rate by 40% with simple website changes.
- Source: CoreDNA
Underwater Audio
- Insight: Increased sales by 41% by removing website distractions.
- Source: Simicart
Al-Bahar & HP Asia-Pacific
- Insight: Created new online stores across different regions, resulting in a 23% increase in online purchases.
- Source: Website Builder Expert
Doll Clothing Patterns
- Insight: Built a successful e-commerce business, earning $50,000 per month in sales.
- Source: Website Builder Expert
Bosch Power Tools
- Insight: Used headless commerce to provide a tailored digital experience, resulting in increased sales.
- Source: Bloomreach
Amazon
- Insight: Drives industry trends; B2B brands like Bosch must adapt to stay relevant.
- Source: Bloomreach
Jessica’s Natural Foods
- Insight: Grew their business by experimenting with deal sites and effective product positioning.
- Source: Website Builder Expert
Ex-criminal’s Success Story
- Insight: Built an online business that generates $80,000 per month in sales.
- Source: Website Builder Expert
Frequently Asked Questions (FAQ)
The global e-commerce market size reached US$ 16.6 Trillion in 2022. Looking forward, IMARC Group expects the market to reach US$ 70.9 Trillion by 2028, exhibiting a growth rate (CAGR) of 27.43% during 2023-2028
The global e-commerce market is expected to reach approximately $6.5 trillion by 2023 and $10 trillion by 2025
The United States and China are significant contributors to the global e-commerce landscape. The U.S. alone had e-commerce sales worth $870 billion in 2021
Amazon, JD.com, and Alibaba are currently the leading companies in the global e-commerce market.
Case studies like Envelopes.com and Underwater Audio show that simple changes to your website and removing distractions can significantly improve conversion rates.
Companies like Al-Bahar & HP Asia-Pacific have successfully expanded by creating new online stores tailored for different regions, resulting in a 23% increase in online purchases.
Conclusion
eCommerce Sales and digital product sales have moved from the periphery to the core of retail strategies. The statistics and case studies in this guide reveal the multi-faceted nature of this digital revolution—from the astronomical figures in sales revenue to promising market projections.
The case studies add a human touch, showing the real-world impact of ecommerce sales, trends and strategies. Whether you’re just starting your e-commerce journey or looking to optimize your existing operations, this guide serves as a comprehensive resource, illuminating the path ahead in the complex but rewarding world of digital sales.

The Ultimate Guide to Digital Products: Everything You Need to Know
So you now know the stats for ecommerce sales, if you have yet to create a digital product, then this guide will be perfect for you to get you started on your solopreneur digital product empire.